The title sounds peculiar, doesn´t it?
However, in accordance with international guidelines on the expression of uncertainty, it will be legitimate to express that one is 95% certain. It will be legitimate to express that the probability is 95 % that the true value is within a certain distance from a central estimate – an uncertainty range.
It is safe to express certainty, if the uncertainty range is wide!

United Nations climate panel can express a high degree of certainty if they just make the uncertainty range wide enough.
And – that is exactly what United Nations climate panel seem to have done.
In my previous post I discovered that United Nations climate panel had all bets covered.
This post quantifies the uncertainty range by using IPCC´s own figures. The uncertainty is quantified in accordance with the internationally recognized standard for expression of uncertainty: Guide to the expression of uncertainty
No wonder United Nations is so certain – the uncertainty range is simply enormous!
Introduction
IPCC states that 93 % of the energy – which is supposed to be absorbed by the 0,01 % of CO2 added to the atmosphere by humans – has been accumulating in the oceans. Therefore, to check if predictions by IPCC match the observations, we have to look for accumulation of energy in the oceans.
In my previous post IPCC would be spot on for any ocean warming! I used figures provided by IPCC, and figures deduced from the IPCC report, together with an average global energy balance model to estimate warming of the oceans from 0 – 2000 m.
The estimate warming was more or less spot on reported warming for the period from 2005 to 2015. (A period when ARGO has been in operation.)
I found that:
– The reported temperature increase based on measurements is: 0,045 K
– The temperature increase deduced from the IPCC report is: 0,035 K;
But, IPCC don´t provide a best estimate for the feedback parameter! I had to deduce the feedback parameter from a diagram in the report. The most important discovery I made was that when I tested the range of feedback parameters from 2,47 to 0,82 W/m2*K I arrived at a “likely” range of ocean warming from 0 K to 0,1 K. The term likely even leaves up to a 34 % probability that the warming is outside this range.
And still – I had only taken into account the uncertainty range IPCC provided for the alpha “feedback parameter”. I had neither taken into account the uncertainty in surface warming in 2011 since preindustrial times – nor the uncertainty in the anthropogenic forcing in 2011 since preindustrial times.
However, it would be interesting to combine all significant uncertainties to see which range of warming is allowed by the climate theory put forward by United Nations climate panel IPCC. Combination of several uncertaintie, however, should be done in accordance with the only international guide to the expression of uncertainty Guide to the expression of uncertainty in measurement. An international guideline IPCC even failed to notice.
(More on that in these posts:)
IPCC didn´t notice an international guideline on the expression of uncertainty!
IPCC don´t even know how to quantify uncertainty!
I looked forward to do an uncertainty analysis to determine the range of ocean warming allowed by the climate theory put forward by IPCC. Here it is!
The first thing to do in an uncertainty analysis is to find the functional expression which expresses the relation between dependent and independent variables.
Functional expression for estimation of ocean warming from 0 – 2000 m based on IPCC figures
The energy balance model is implicitly endorsed by IPCC, as can be seen in the following illustration in the IPCC report:
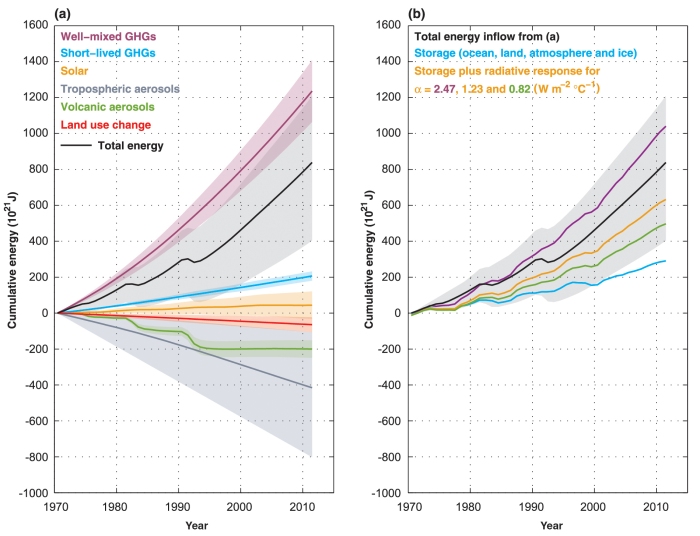
TFE.4, Figure 1 | The Earth’s energy budget from 1970 through 2011.
(a) The cumulative energy inflow into the Earth system from changes in well-mixed and short- lived greenhouse gases, solar forcing, tropospheric aerosol forcing, volcanic forcing and changes in surface albedo due to land use change (all relative to 1860–1879) are shown by the coloured lines; these contributions are added to give the total energy inflow (black; contributions from black carbon on snow and contrails as well as contrail-induced cirrus are included but not shown separately).
(b) The cumulative total energy inflow from (a, black) is balanced by the sum of the energy uptake of the Earth system (blue; energy absorbed in warming the ocean, the atmosphere and the land, as well as in the melting of ice) and an increase in outgoing radiation inferred from changes in the global mean surface temperature. The sum of these two terms is given for a climate feedback parameter of 2.47, 1.23 and 0.82 W m–2 °C–1, corresponding to an equilibrium climate sensitivity of 1.5°C, 3.0°C and 4.5°C, respectively; 1.5°C to 4.5°C is assessed to be the likely range of equilibrium climate sensitivity. The energy budget would be closed for a particular value of if the corresponding line coincided with the total energy inflow. For clarity, all uncertainties (shading) shown are likely ranges. {Box 12.2; Box 13.1, Figure 1}
TFE.4, Figure 1b relates the cumulative total energy change of the Earth system to the change in energy storage and the cumulative outgoing radiation. Calculation of the latter is based on the observed global mean surface temperature multiplied by the climate feedback parameter alpha , which in turn is related to the equilibrium climate sensitivity.
Page 68
The model which IPCC seem to provide parameters for here is the average energy balance model by Schneider and Mass, referred to in the introduction to the following On the Meaning of Feedback Parameter … ( Gerhard Kramm and Ralph Dlugi 2010 )
C * dT/dt = Q – ( lambda * T )
As IPCC use alpha rather than lambda this becomes:
dT = (( Q – ( alpha * T ) ) * dt ) / C
dT: Temperature increase over time period increment dt: ( 2005 – 2015 )
Q: Anthropogenic radiative forcing in 2011: ( 2,3 W / m2 )
alpha: deduced IPCC feedback parameter (termed alpha): ( 1,9 W / m2*K )
T surface: Surface temperature in 2011 minus temperature in 1750: ( 0,85 K )
C: Heat capacity of the material receiving the energy
As the 10 years from 2005 to 2015 is a relative short period, Q (anthropogenic radiative forcing) and T (Temperature increase since 1750), will here be assumed to be independent of time t in that period. Hence, the equation can be solved quite easily.
The next thing we have to consider is that this is an analysis of the temperature increase in the oceans from 0 – 2000 m water depth. Hence we need to know the fraction of the energy which is supposed to go into the oceans from 0 – 2000 m (R oceans 2000). And the heat capacity of the oceans from 0 – 2000 m. (C oceans 2000).
Hence, the final expression becomes:
dT = (( Q – ( alpha * T ) ) * dt ) * R oceans 2000 / C oceans 2000
R oceans 2000:
Relative amount of accumulated energy going into the oceans from 0 – 2000 m
C oceans 2000:
Heat capacity of the oceans from 0 – 2000 m
And that is the expression I use to deduce from the IPCC report the amount of warming of the oceans from 0 – 2000 m in the period from 2005 to 2015.
—
I will not claim that the model is right, and I will not claim that the parameters are right. However IPCC seems to endorse the energy balance model by providing parameters for the model.
Quantification of uncertainty
Having established the functional relationship between the figures provided by IPCC. And, in an inductive manner, having demonstrated that the functional relationsship together with parameters provided by IPCC provides a result which is consistent with reported warming (IPCC would be spot on for any ocean warming!). We are then ready to start to collect estimates and uncertainties for the uncertainty calculation.
In addition to the functional relationship we will need the following for each variable:
– a central estimate
– the stated uncertainty
– the confidence level
As allowed in an uncertainty analysis, I will disregard insignificant contributors to the uncertainty estimate. I have considered that the following parameters / variables have insignificant effect on this uncertainty analysis:
– dt; duration of the time period considered here
– R oceans 2000: Relative amount of accumulated energy going into the oceans from 0 – 2000 m (IPCC does not seem to consider this value as having considerable uncertainty)
– C oceans 2000: Heat capacity of the oceans from 0 – 2000 m
– my assumption that the variables are independent of time over the 10 year period I have considered in this uncertainty analysis.
These are the variables I consider having significant uncertainty:
– Q: Anthropogenic radiative forcing in 2011: ( 2,3 W / m2 )
– alpha: deduced IPCC feedback parameter: ( 1,9 W / m2*K )
– T surface: Surface temperature in 2011 minus temperature in 1750: ( 0,85 K )
The procedure I will follow is to:
– Deduce a central estimate for each variable
(From the IPCC report)
– Determine stated uncertainty for each variable
(From the IPCC report)
– Determine the confidence level for each uncertainty
(From the IPCC report)
– Convert the uncertainty at the given confidence level to 1 standard uncertainty
(Table over confidence level, and standard uncertainty factors)
– Find the sensitivity coefficient for the output to each significant variable
(By a small change in the variable to see the effect on the output)
– Find the variance for each significant variable
(sensitivity coefficient * 1 standard uncertainty)^2
– Find the sum of variances
(Add all variances)
– Find one standard uncertainty
(Square root of the sum of variances)
– Determine the uncertainty of the output at 95% confidence level
(95 % confidence level is commonly used, equal to 2 standard deviations)
In the uncertainty analysis, I will make the simplification that the uncertainties have a Gaussian normal distribution. I also assume that the uncertainty of anthropogenic radiative forcing in 2011, uncertainty in the feedback parameter alpha and uncertainty in temperature increase in 2011 since pre industrial times are uncorrelated.
IPCC uses a 90 % confidence interval unless otherwise stated.
The first thing to note is that IPCC uses a 90 % confidence interval unless otherwise stated:
In the WGI contribution to the AR5, uncertainty is quantified using 90% uncertainty intervals unless otherwise stated. The 90% uncertainty interval, reported in square brackets, is expected to have a 90% likelihood of covering the value that is being estimated. Uncertainty intervals are not necessarily symmetric about the corresponding best estimate. A best estimate of that value is also given where available.
Page 5; Note 3:
A 90 % confidence interval can be converted to 1 standard uncertainty in the following way:
The coverage factor for a 90 % confidence interval is 1,645. This means that, for a normal (gaussian) distribution, the standard uncertainty (providing a 68 % confidence level) can be found by dividing the uncertainty provided for a 90 % confidence interval by 1,645.
The figure 1,645 is found at the bottom line in the following table:
http://www.sjsu.edu/faculty/gerstman/StatPrimer/t-table.pdf
(In this uncertainty analysis I will make the simplicfication that all uncertainty figures are based on a huge number of trials. The uncertainty in the output, estimated ocean warming based on IPCC figures, would be even larger if I had taken into account that a limited number of trials form the basis for the uncertainty figures provided by IPCC.)
The total anthropogenic radiative forcing
IPCC´s estimate for total anthropogenic Radiative Forcing is summarized on page 16 in the fifth assessment report from IPCC.
The total anthropogenic Radiative Forcing for 2011 relative to 1750 is
2.29 [1.13 to 3.33] W m−2Page 16
Hence, the central estimate for total anthropogenic radiative forcing is 2,29 W/m2.
As we remember that brackets around a range mean a 90 % confidence interval, the uncertainty at a 90% confidence level is:
(3,33 – 1,13) / 2 = 1,1 W/m2
If we divide this value by 1,645 we get the value for 1 Standard uncertainty ( 68 % confidence level ):
(1,1 W/m2 )/ 1,645 = 0,67 W/m2
Hence:
Q: Anthropogenic radiative forcing in 2011 as compare to preindustrial times is deduced from the IPCC report to be:
2,3 W/m2 +- 0,67 W/m @ 68 % confidence level
The temperature increase since pre-industrial times 1750 – T
T surface: Surface temperature in 2011 minus temperature in 1750: ( 0,85 K )
The globally averaged combined land and ocean surface temperature data as calculated by a linear trend, show a warming of 0.85 [0.65 to 1.06] °C , over the period 1880 to 2012, when multiple independently produced datasets exist.
Page 5
Hence, the central estimate for Surface temperature in 2011 as compared to preindustrial times is: 0,85 K
As we remember that brackets around a range mean that the range covers a 90 % confidence interval, the uncertainty at a 90% confidence level is:
(1,06 – 0,65) / 2 = 0,2 K
If we divide this value by 1,645 we get the value for 1 Standard uncertainty ( 68 % confidence level ):
(0,2 K )/ 1,645 = 0,12 K
Hence:
T surface: Surface temperature in 2011 minus temperature in 1750 deduced from the IPCC report is:
0,85 K +- 0,12 K @ 68 % confidence level
How do we convert «likely» to 1 standard uncertainty?
Click to access uncertainty-guidance-note.pdf
To understand how the term likely converts to a confidence level we must turn to the Guidance Note for Lead Authors of the IPCC Fifth Assessment Report on Consistent Treatment of Uncertainties.
The following table gives an idea about the confidence level associated with the various terms used by IPCC:
Table 1.2 | Likelihood terms associated with outcomes used in the AR5.
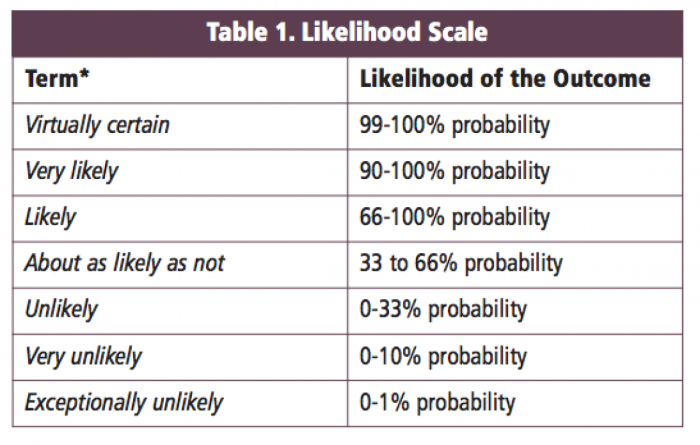
It accordance with this table, the term “Likely” means that the confidence level in the relevant figure can be as low as 66%. As the point of this post is to quantify the width of the uncertainty range, I will argue that the confidence level can be as low as 66% for the term “likely”. Hence, for simplicity I will assign a confidence level of 68 % corresponding to 1 standard uncertainty to the term likely.
(Note 1: Actually this way of expressing confidence is not all in accordance with the internationally recognized guideline: Guide to the expression of uncertainty in measurement. Consequently, my way of converting this term to confidence level can be criticized. I w There is so much to criticize in in the guidance document. Those who are interested in my critique of that document can have a look at the following posts:
IPPC did exactly what should be avoided in objective science!
IPCC didn´t notice an international guideline on the expression of uncertainty!
However these posts are not absolutely required references for this post.)
Uncertainty of the climate feedback parameter – alpha
As can be seen from the following quotes, a central estimate for the climate feedback parameter is not provided. We also see that the climate feedback parameter is closely related to the equilibrium climate sensitivity.
Equilibrium climate sensitivity is likely in the range 1.5°C to 4.5°C (high confidence), extremely unlikely less than 1°C (high confidence), and very unlikely greater than 6°C (medium confidence)Note 16.
Note 16 No best estimate for equilibrium climate sensitivity can now be given because of a lack of agreement on values across assessed lines of evidence and studies.
Ref.: Page 16
TFE.4, Figure 1 | The Earth’s energy budget from 1970 through 2011.
(b) The cumulative total energy inflow …. is balanced by the sum of the energy uptake of the Earth system … and an increase in outgoing radiation inferred from changes in the global mean surface temperature.
The sum of these two terms is given for a climate feedback parameter of 2.47, 1.23 and 0.82 W m–2 °C–1, corresponding to an equilibrium climate sensitivity of 1.5°C, 3.0°C and 4.5°C, respectively; 1.5°C to 4.5°C is assessed to be the likely range of equilibrium climate sensitivity.
The energy budget would be closed for a particular value of the climate feedback parameter if the corresponding line coincided with the total energy inflow. For clarity, all uncertainties (shading) shown are likely ranges
– Page 67; TFE.4, Figure 1 | The Earth’s energy budget …
As IPCC does not provide a best estimate, I will have to deduce a best estimate in order to be able to perform an uncertainty analysis in accordance with the recognized guideline. I we again look at the following figure, we see that a climate feedback parameter of: 1,85 W/m2*K would “close the energy budget as stated by IPCC. (1,85 is in the middle betweenHence – I will use this as a central estimate for the climate feedback parameter:
Combining the uncertainties
Now we have all the parameters we need, and the corresponding uncertainty ranges to compute the central estimate for warming of the oceans from 0 – 2000 m for the period from 2005 to 2015 and the corresponding uncertainty range.
Functional relationship, central estimate for variables having considerable uncertainty, and uncertainty estimate has been given above. Explanation for other parameters are given in the post: IPCC would be spot on for any ocean warming! but also linked in the table below:
|
0-2000 m |
||
| Units |
Deduced central estimate |
|
| IPCC estimate of total anthropogenic Radiative forcing in 2011 relative to 1750.
Ref. IPCC Summary for policy makers C. Drivers of Climate Change. «The total anthropogenic RF for 2011 relative to 1750 is 2.29 [1.13 to 3.33] W m−2» |
W / m2 |
2,3E+00 |
| Feed back parameter
Deduced from TFE.4, Figure 1 | The Earth’s energy budget from 1970 through 2011 |
W / m2*K |
1,9E+00 |
| Temperature increase since 1750
Ref IPCC AR5; WGI; Page 5 |
K |
9,0E−01 |
| Outgoing radiation | W / m2 |
1,7E+00 |
| IPCC – Current system heat uptake rate | W / m2 |
6,3E−01 |
| Global surface area 510,072,200 km2 | m2 |
5,1E+14 |
| Deduced IPCC estimate of total anthropogenic radiative forcing | W |
3,2E+14 |
| Fraction of energy going into the relevant part of the oceans
«Ocean warming dominates the global energy change inventory. Warming of the ocean accounts for about 93% of the increase in the Earth’s energy inventory between 1971 and 2010 (high confidence), with warming of the upper (0 to 700 m) ocean accounting for about 64% of the total. Warming of the ocean between 700 and 2000 m likely contributed about 30% of the total increase in global ocean heat content (0 to 2000 m) between 1957 and 2009.» Ref. IPCC; WG1;AR5; Oceans; executive summary; Temperature and Heat Content Changes |
Fraction |
9,2E−01 |
| Deduced IPCC estimate of amount of energy going into the relevant part of the oceans | W |
2,9E+14 |
| Deduced IPCC estimate of amount of energy going into the relevant part of the oceans per second | J / s |
2,9E+14 |
| Number of seconds per year | s |
3,2E+07 |
| Deduced IPCC estimated for amount of energy going into the relevant part of the oceans | J / 1year |
9,2E+21 |
| Deduced IPCC estimate for amount of energy going into the relevant part of the oceans | J / 10year |
9,2E+22 |
| Mass of all the oceans 1,4 E18 metric tons | kg |
1,4E+21 |
| Relevant part of the oceans / all oceans
-52% of ocean volume below 2000 m That obviously means that about 48% of the ocean volume is above 2000 meters. Assuming those percentages are close to being correct, that means 41.66 % of the volume of the oceans to depths of 2000 meters comes from the top 700 meters and 58.33% at 700-2000 meters.» |
Fraction |
4,8E−01 |
| Specific heat capacity for water | J / kg*K |
4,0E+03 |
| Heat capacity for the relevant part of the oceans | J / K |
2,7E+24 |
| Deduced IPCC estimate for average warming of the relevant part of the oceans. | K / year |
3,5E−03 |
| Deduced IPCC estimate for average warming of the relevant part of the oceans. | K / 10year |
3,5E−02 |
| Uncertainty in Anthropogenic forcing since 1750 | W/m2 |
1,1E+00 |
| Confidence interval for uncertainty in anthropogenic forcing since 1750 | % |
90,0 |
| Coverage factor for stated confidence interval | (std uncertainties) |
1,645 |
| 1 standard uncertainty for the feedback parameter | W/m2 |
6,7E−01 |
| Sensitivity of ocean warming to Anthropogenic radiative forcing since 1750 | (K/10year)/(W/m2) |
5,6E−02 |
| Variance; ( 1 standard uncertainty * sensitivity )^2 | (K / 10year)^2 |
1,4E−03 |
| Uncertainty of the feedback parameter; stated in the IPCC report | W/m2*K |
8,3E−01 |
| Confidence interval for uncertainty in the feedback parameter | % |
68 |
| Coverage factor for stated confidence interval | (std uncertainties) |
1,000 |
| 1 standard uncertainty for the feedback parameter | W/m2*K |
8,3E−01 |
| Sensitivity of ocean warming to the feedback parameter | (K/10year)/(W/m2*K) |
−5,0E−02 |
| Variance; ( 1 standard uncertainty * sensitivity )^2 | (K / 10year)^2 |
1,7E−03 |
| Uncertainty of the temperature increase since 1750; from the IPCC report | K |
2,0E−01 |
| Confidence interval for the uncertainty of the temperature increase since 1750 | % |
90 |
| Coverage factor for stated confidence interval | (std uncertainties) |
1,645 |
| 1 standard uncertainty for the temperature increase since 1750 | K |
1,2E−01 |
| Sensitivity of ocean warming to temperature increase since 1750 | (K/10year)/(K) |
−1,0E−01 |
| Variance; ( 1 standard uncertainty * sensitivity )^2 | (K / 10year)^2 |
1,6E−04 |
| Sum of variances for all significant contributors to uncertainty | (K / 10year)^2 |
3,3E−03 |
| Combined standard uncertainty for all significant uncertainty contributions | K / 10year |
5,7E−02 |
| Uncertainty at 66 % confidence level | K / 10year |
5,7E−02 |
| Uncertainty at 95 % confidence level ( 2 * uncertainty at 66 % confidence level) | K / 10year |
1,1E−01 |
It is then time to present the result of the uncertainty analysis performed in this post:
Ocean warming from 0 – 2000 m for the period from 2005 – 2015; estimated by using the average energy balance model of Schneider and Mass; and parameters deduced from Working Group I contribution to the fifth assessment report from IPCC (2013) is:
Central estimate and uncertainty for ocean warming; 0-2000 m depth; for the period 2005-2015; based on figures in the UN IPCC; AR5; WGI:
0,035 K +- 0,11 K @ 95 % confidence level.
I´m not sure what to make out of this. The uncertainty level even allows cooling of the oceans, there is clearly an inconsistency with many possible explanations:
– The uncertainty ranges provided by IPCC are too wide
– The average energy balance model is flawed
– There are significant errors in my calculations
– Radiative forcing and climate feedback parameter will have to be regarded as a correlated pair.
I really don´t know. But maybe I´m onto an inconsistency?
Could be – here is a paper that also finds that the anthropogenic radiative forcing may produce a decrease of the Earth’s surface temperature:
As we argued on the basis of Eq. (2.23), the anthropogenic radiative forcing may produce a decrease of the Earth’s surface temperature. Also this result gives evidence that the global energy balance climate model of Schneider and Mass [2] leads to inconsistent physical consequences.
– On the Meaning of Feedback Parameter … ( Gerhard Kramm and Ralph Dlugi 2010 )
– 7. SUMMARY AND CONCLUSIONS
And much more than pointing to that inconsistency, Kramm and Dlugi also argue that:
Moreover, both the model of Schneider and Mass and the Dines-type two-layer energy balance model for the Earth- atmosphere system, containing the planetary radiation balance for the Earth in the absence of an atmosphere as an asymptotic solution, do not provide evidence for the existence of the so-called atmospheric greenhouse effect if realistic empirical data are used.
I will let it be with that – for now.


